The president of a major philanthropy walked into the meeting room carrying an annual report from an education-focused nonprofit and laid it on the table next to the annual report from his organization.
Resting his hand on the nonprofit’s report, he said, “This is one of the most beautiful pieces I’ve seen in a long time.”
Opening it, he revealed a copy-dense report punctuated by photos, charts, infographics, and typography elements that helped him understand the story visually. He noted, “I don’t need to read the full report. The quotes and infographics tell me the entire story.”
The president’s comments confirmed what we know and practice:
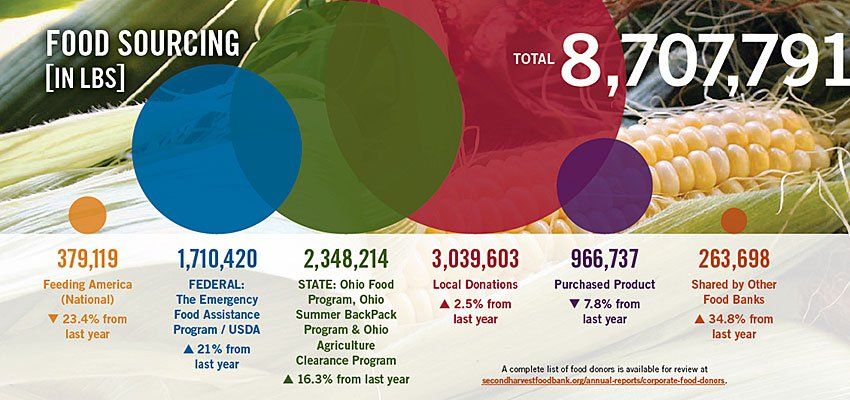
An infographic is a visual representation of data that aids understanding. It is a way to summarize and simplify complex information, but infographics do not meet the need of every narrative and story. Storytelling becomes more compelling when you combine your inspirational words with infographics, photos, typography, color, and charts with design elements that integrate and create cohesiveness.
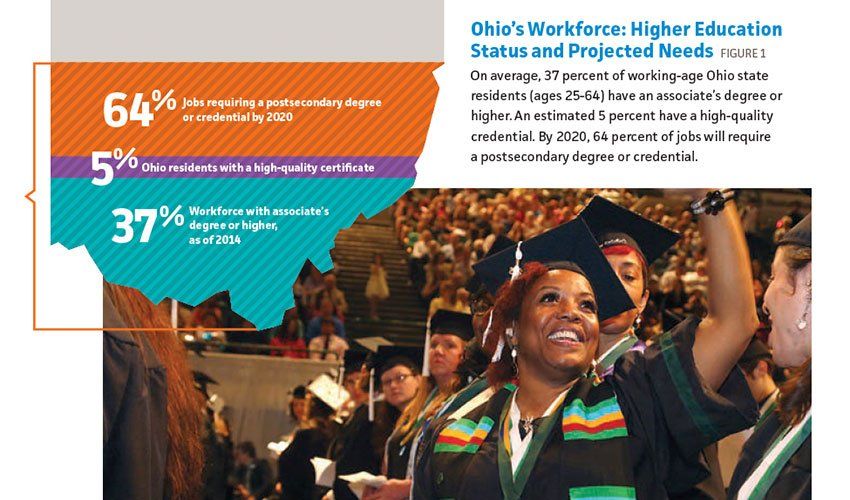
Reporting Educational Attainment to the Community
The Higher Education Compact Greater Cleveland report focuses on college readiness, college access, and college persistence.
In this example, infographics, photos, and a brief call out interpret and explain the relevant information in multiple ways for the needs of different readers. Quotes from key stakeholders and leaders are a custom feature of the report, printed in white ink on a vibrant blue paper to reinforce the importance of these highlights in the overall narrative. (Click here to read the full report)
City skyline
Photo By: John Doe
Button
Birthday Sparks
Photo By: John Doe
Button
Visual Storytelling for Foundations and Grantmakers
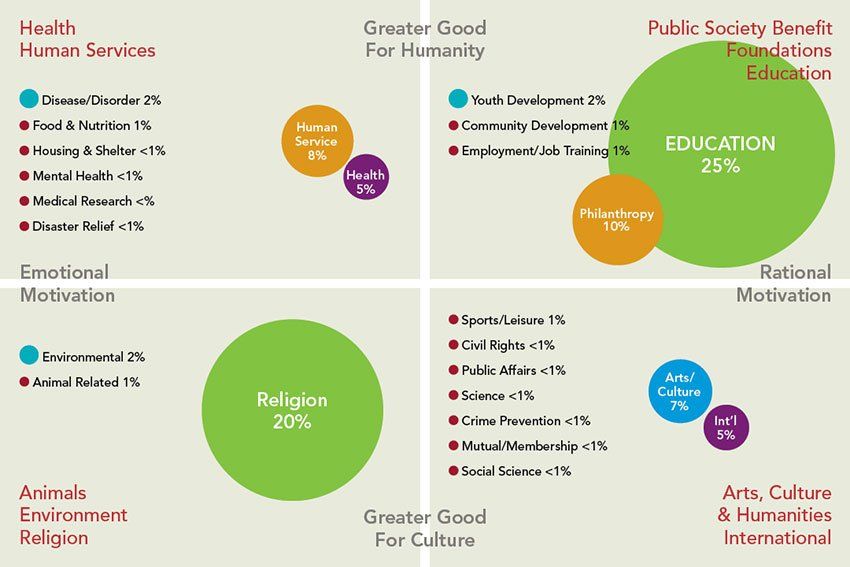
Beginning in 2014, American Endowment Foundation (AEF), America’s largest independent provider of donor-advised funds, reviewed the grant distributions made between September 2010 to September 2014, totaling over $228 million in donations.
The top five causes were education, religion, philanthropy, human service and arts/culture.
When the numbers for 2015 were available (along with those of Giving USA), it became a perfect opportunity to create a visual story from the data, the National Taxonomy of Exempt Entities classifications, and The Cause Quadrant from Raise Your Voice: A Cause Manifesto.
If your cause is one of the top five, that’s encouraging news. If you’re one of the other 21 subgroups represented in the complete NTEE list, you’ll have to work a little harder to share your story and build interest for your cause.
If your cause is one of the top five, that’s encouraging news. If you’re one of the other 21 subgroups represented in the complete NTEE list, you’ll have to work a little harder to share your story and build interest for your cause.
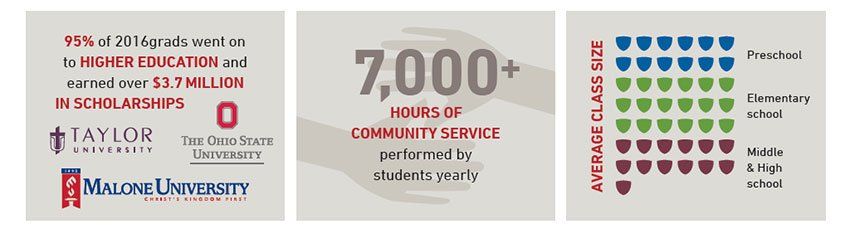
Visual Storytelling for Education
Infographics can help you capture the relevance, value, and uniqueness of your educational institution. The most important thing to remember is who the audience is for your intended communications. In this instance, the audience is prospective parents and donors:
Visual Stories Demonstrate Mission, Scope, and Impact
The Benefits of Being Informational and Inspirational
Why do infographics appeal to us? They are examples of the best aspects of design. In an eye-tracking study, Amy Alberts noted:
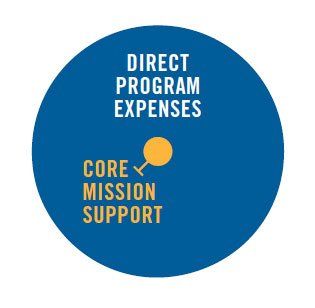
Perhaps a few of your donors enjoy reading the financials, but I’ll bet there are more who would appreciate the data and understand your impact better if you punctuated your narrative by practicing visual storytelling.
Your board may begin to understand the outcomes of your mission if the entire board report is summarized in a dashboard style visual format. It’s more work for you, but more compelling (and shareable) for your ambassadors and advocates.
In your storytelling narrative and the engagement continuum of your communications, visual design is a critical element to
inform, inspire, and persuade donors and stakeholders who care about your cause. Stay true to your mission and the value and relevance you’re trying to communicate by making the informational and inspirational elements of design central to your donor communications.