Service Business Marketing Campaign Trends - October 2024
Every home services company owner dreads the month of September. It's called the shoulder month because the lead volume and sales drop. If you didn't add non-digital campaigns to your marketing mix, you may be experiencing lower lead and revenue volume.
- Programmatic Marketing (AI-enhanced native and display campaigns)
- Google Ads (PPC) Campaign Trends
- Google Business Profile Optimization
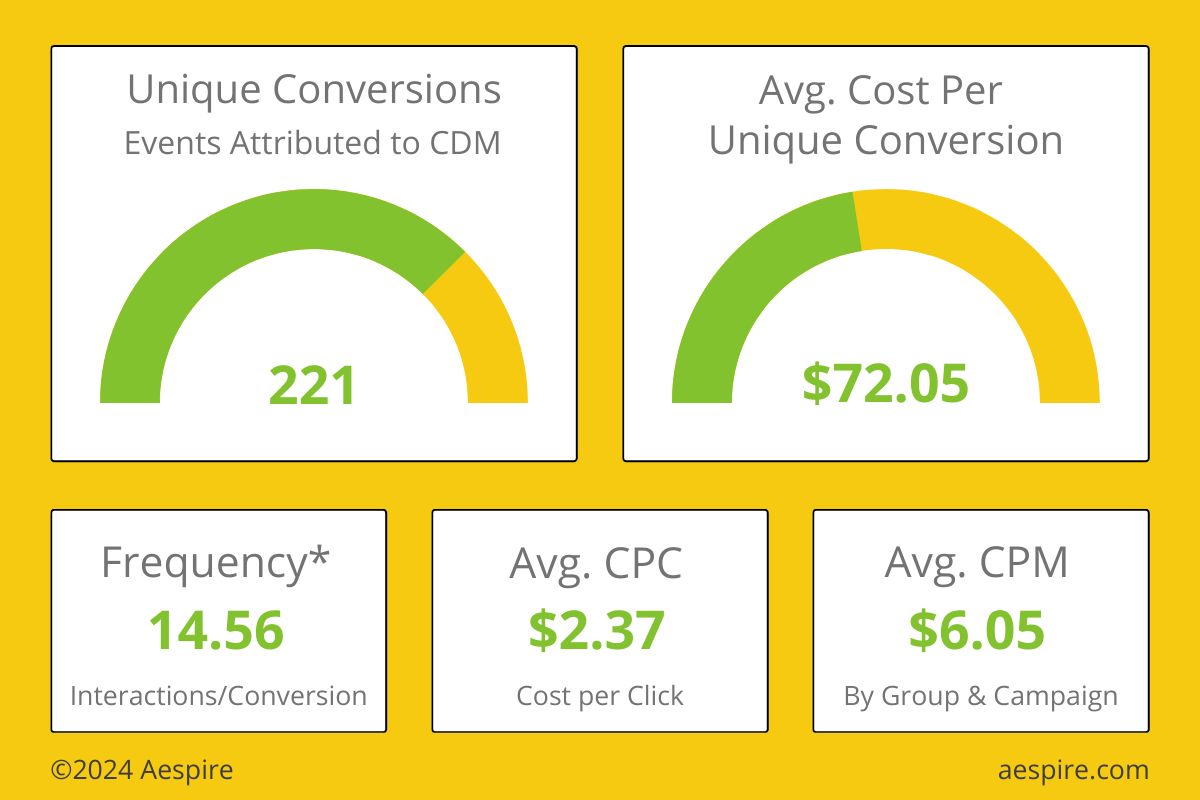
Within our programmatic Contextual Digital Marketing* campaigns, it costs as little as $2.37 per conversion to engage a heating, cooling (HVAC), electrical, or plumbing customer through native and display programmatic marketing campaigns in September 2024.*
Compared to September 2024, the average cost per unique conversion rose.
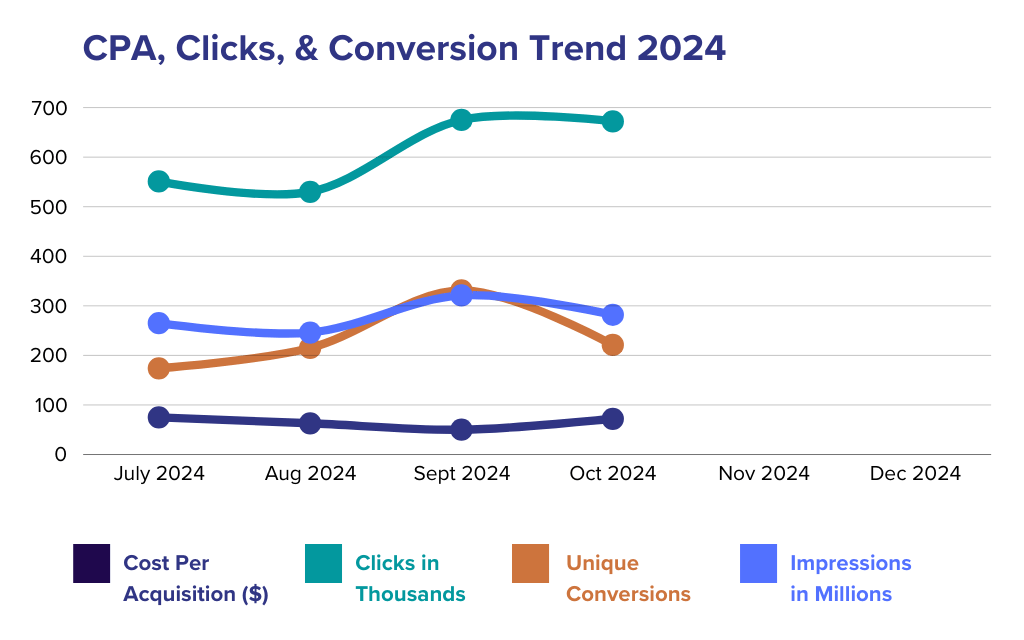
As we anticipated, costs increased in October 2024 as demand softened, finances tightened, and the 2024 election loomed.
The following is aggregated average data for three distinct US markets (one established and two new market entries into the residential home services market):
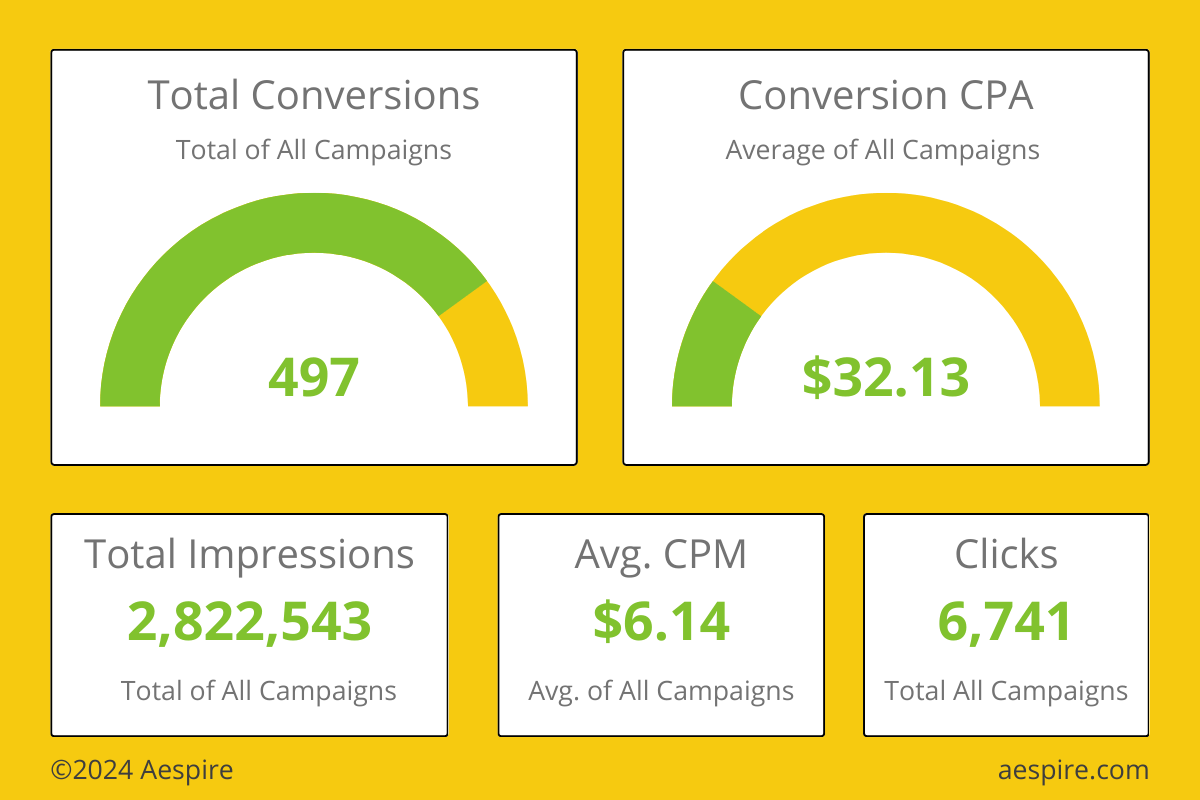
- Total conversions: 497 (-40%)
- Average Cost Per Unique Conversion: $72.05 (43%)
- Average Overall Cost of all Conversions by Campaign: $32.13
- Impressions: 2,822,543
- User Actions: 6,717
- Cost Per Click: $2.37
- Cost Per Thousand: $6.16
- Frequency: 14.56%*
Website Referrers Contribute to Website Traffic
- Programmatic Digital Campaigns (native and display ads): 45% of website traffic on average
- CTV and Video Streaming Ads: 4% of site traffic
- Local SEO and GBP Optimization: 4% (+ 4%)
- Organic Search: 11-40% (Depending on market)
Recommendations
- Based on the quantity of traffic and relevance that digital ad campaigns contribute to website traffic, reconsider using a service that directs digital ad traffic to off-site landing pages.
- Traffic trends skew heavily to mobile — 95%+ or more of your add traffic is from mobile devices. Optimize your landing pages and Assets for mobile!
Stay current on the national financial, corporate, and supply change trends shaping the essential home services industry when you subscribe to the HomePros newsletter.
With Google changing search results to favor zero-click results, it's imperative to add local SEO, Google Business Profile optimization, and AI to hyper-target your ideal preferred customers.
It's also critical to analyze if any emerging patterns predict future consumer behavior changes.
- Total conversions: 497 (-40%)
- Average Cost Per Unique Conversion: $72.05 (43%)
- Average Overall Cost of all Conversions by Campaign: $32.13
- Impressions: 2,822,543
- User Actions: 6,717
- Cost Per Click: $2.37
- Cost Per Thousand: $6.16
- Frequency: 14.56%*
Website Referrers Contribute to Website Traffic
- Programmatic Digital Campaigns (native and display ads): 45% of website traffic on average
- CTV and Video Streaming Ads: 4% of site traffic
- Local SEO and GBP Optimization: 4% (+ 4%)
- Organic Search: 11-40% (Depending on market)
Recommendations
- Based on the quantity of traffic and relevance that digital ad campaigns contribute to website traffic, reconsider using a service that directs digital ad traffic to off-site landing pages.
- Traffic trends skew heavily to mobile — 95%+ or more of your add traffic is from mobile devices. Optimize your landing pages and Assets for mobile!
Home Services Digital Marketing Trends Glossary
- Programmatic Marketing is more efficient and effective than traditional native or pay-per-click ad campaigns.
- Programmatic Marketing campaigns hyper-focus on your Ideal Preferred Customer, delivering the right message at the right time.
- Programmatic Marketing campaigns target the right people with the right message based on their interests and behavior.
- Programmatic Marketing campaigns integrate artificial intelligence (AI) guided by a data scientist to hyper-target your ideal preferred customers. Using AI-enhanced targeting doubles the impact of your budget.
- Custom audiences are specific to your category, competitors, and business goals. Programmatic marketing serves ads in the content of the page or app (using contextual targeting) when the user is in the right frame of mind.
- Custom audiences are developed by a Data Scientist and augmented intelligence machine learning in real-time as prospects are active and thinking about your category and the problem they want to solve.
- By knowing exactly what you want to achieve, an advanced learning framework and AI strategies analyze the behavior of every internet user’s digital footprint in your market area and hyper-targets the right people at the right time and doubles the impact of your budget.
- Frequency is the number of times a user sees an ad before they take an action. The industry average frequency is 20-30.
- Conversion Events include phone calls, ServiceTitan Schedule Pro bookings started and completed, and form fills.
- ServiceTitan Schedule Pro (or ScheduleEngine) completion rate is typically less than 20%
- As with any data, these results are reflective of specific markets and conditions and do not reflect the results you may achieve through Aespire's Home Services and Blue Collar marketing programs.